
Sarah is a director of a 25-person telecoms business. Things are busy — properly busy. The team is stretched. Quotes are taking too long. The CRM is a mess. Installations are slipping through the gaps.
So she does what every sensible business owner does. She opens a job board and starts writing a job description for an Operations Manager.
She lists the responsibilities. Oversee day-to-day operations. Coordinate between departments. Improve internal processes. Manage the CRM.
The job ad looks right. It uses the right language. It describes a real problem.
But here is what Sarah is actually trying to fix: four specific workflows that nobody owns, nobody has mapped, and nobody has ever looked at properly. She doesn't need an Operations Manager. She needs those four workflows to work.
The title is the wrong unit of measure.
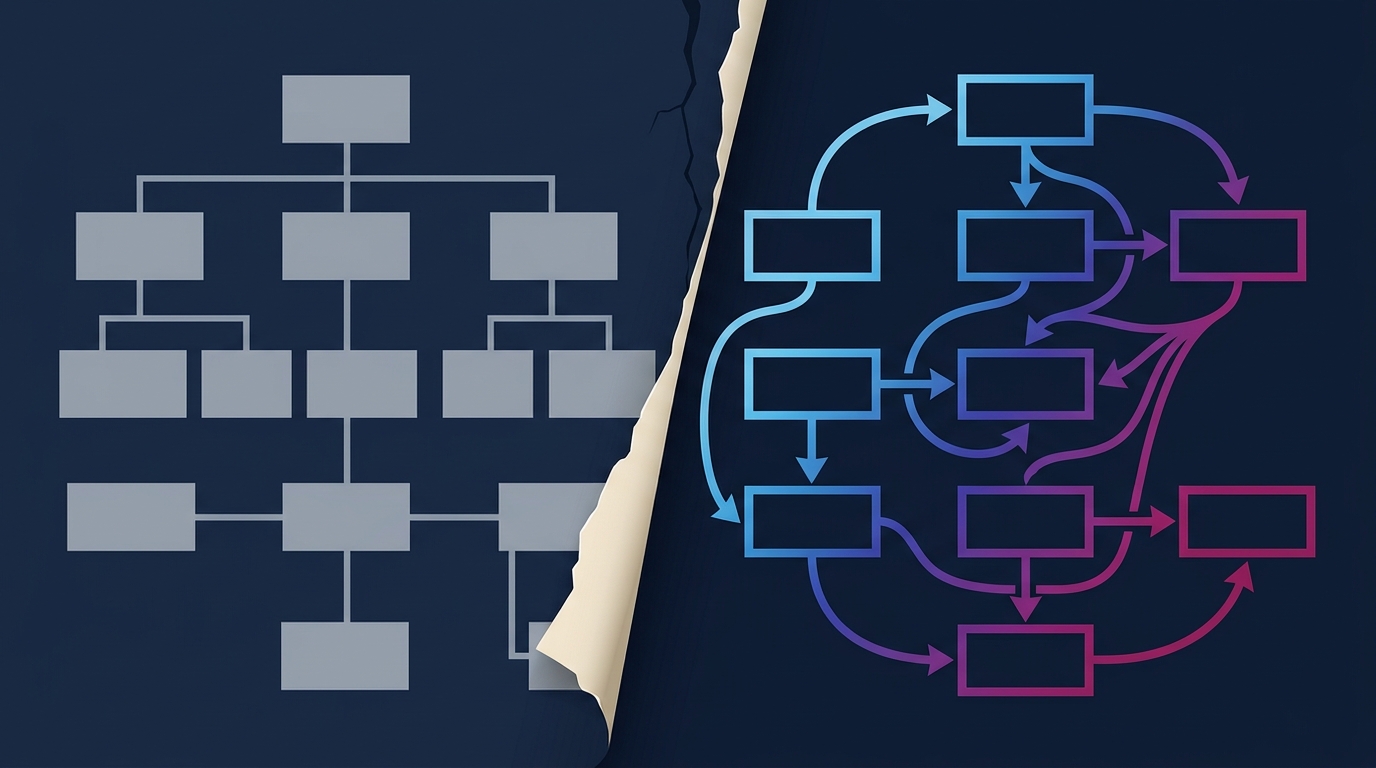
The Org Chart Feels Like Clarity. It Isn't.
Most businesses are drawn as org charts. Boxes with names. Lines showing who reports to who. It looks organised. It gives owners a feeling of structure and order.
But an org chart doesn't tell you how work actually moves through your business.
It doesn't show you where information gets stuck, where manual effort is highest, or where a single task is being completed three times by three different people because nobody ever connected the dots.
The org chart is a map of accountability. That's useful. But it is not a map of how value is created — or where it is quietly being destroyed.
Most operational problems don't live in the boxes. They live in the gaps between them.
Here Is the Shift That Changes Everything
Your business doesn't run on people. It runs on workflows.
A workflow is simply a sequence of inputs and outputs. Something comes in — an enquiry, an order, a request, a piece of information. Something goes out — a quote, an update, a confirmation, a response. Everything in between is the workflow.
People sit inside workflows. They always have. A job title is just a label for which workflows a person is responsible for. Strip away the title and what you actually have is: this person handles these six sequences of inputs and outputs.
That is the shift. From thinking in roles to thinking in workflows. From drawing boxes to drawing flows.
And once you make that shift, two things happen almost immediately.
First, you see your operational problems far more clearly. Instead of asking "why is this department struggling?", you ask "which specific workflow is breaking, and exactly where is it breaking?"
Second — and this is where it gets interesting — you start to see which parts of those workflows actually need a human being, and which parts don't.
1. What a Workflow Map Actually Looks Like
Take a simple example. Sarah's telecoms business receives a new customer enquiry.
In the org chart view, that enquiry "belongs to" the sales team. Someone in sales handles it. That's the end of the thinking.
In the workflow view, it looks different:
→ Enquiry arrives via email → Someone reads it and qualifies it → Details are entered into the CRM (the business's contact management system) → A quote is generated → The quote is sent to the client → A follow-up is scheduled → The outcome is logged
Seven steps. Each one is either something a human needs to do — or something that can happen automatically.
In Sarah's business, steps one, three, five, and six are being done manually. By a person. Every single time. For every single enquiry.
That's not an operations problem. That's a workflow visibility problem. And you cannot fix what you cannot see.
2. The Old Way and the New Way
The Old Way — org chart thinking:
→ Something is slow or broken → Identify which team the problem sits in → Consider hiring someone to fix it, or add it to an existing job description → Hope the new person figures it out
The New Way — workflow thinking:
→ Something is slow or broken → Map the exact sequence of steps involved → Identify where manual effort is highest and where errors occur most → Decide which steps require genuine human judgment and which are just data moving from one place to another → Automate the latter. Hire for the former — if you still need to at all.
Result: you stop adding headcount to patch broken processes and start fixing the process itself.
The difference sounds simple. In practice, it changes almost every operational decision you make.
3. Why This Matters for Automation
Automation is, at its core, connecting inputs to outputs without a human in the middle. Information arrives somewhere, something happens to it, it moves somewhere else. That's it.
When you see your business as an org chart, automation feels abstract and difficult to place. "Where do we even start?"
When you see your business as a set of workflows, the answer becomes obvious. You look at each step in each workflow and ask one question: does this step require a human to think, judge, or decide — or is it just moving information from A to B?
If it is the latter, it can almost certainly be automated.
In our experience working with UK SMBs, the average business has between 8 and 15 significant workflows running at any given time. Most owners can name 3 or 4 of them off the top of their head. The rest are invisible — they exist, they run, they consume time and money every week, but nobody has ever drawn them out.
That's where the cost hides.
4. The Maths of Hiring Into a Broken Workflow
Here is a number worth sitting with.
The average fully-loaded cost of a UK employee — salary plus employer National Insurance, pension contributions, holiday pay, and non-productive time — is roughly £31.25 per hour for someone on a £50,000 salary.
Now imagine Sarah hires that Operations Manager at £45,000 per year to "sort out the processes." Fully loaded, that's around £56,250 annually.
If 60% of what that person will spend their time on is moving information between systems — data entry, logging updates, chasing emails, copying from one tool into another — then £33,750 of that salary is paying a human being to do work that requires no human judgment whatsoever.
That same work, automated, typically costs between £3,000 and £8,000 to build. Once. With no salary, no holiday, and no notice period.
Sarah doesn't have a headcount problem. She has a workflow visibility problem. And the cost of not seeing it clearly is tens of thousands of pounds every year, quietly compounding.
Summary
The org chart is a useful tool. But it is the wrong map for understanding where your operational problems actually live — and it is the wrong map for finding where automation can help.
Your business runs on workflows. Always has. The shift is simply learning to see it that way.
When you can draw your business as a sequence of inputs and outputs — rather than a set of job titles and reporting lines — you gain two things at once: a clear picture of where time and money are being lost, and a clear answer to which parts of your operation genuinely need a person, and which parts just need a better process.
The businesses that make this shift will build operations that scale without adding headcount at every growth stage. The ones that don't will keep hiring people into workflows that were never designed to work.
If you want to map your workflows and find out exactly where manual work is costing you most, that's precisely what the AI Opportunity Audit is designed to do. No cost. No obligation. Just clarity.
Book your free Audit here: www.aideal.group/
Thanks for reading!